















TechPratham

Start typing to search courses...

Type in the search box to find courses
CoursesHigh Demanding
Data Analytics Training in Delhi
High Demanding

Data Analytics Training in Delhi

Build practical skills with Data Analytics Training in Delhi. Learn Excel, SQL, Python, Statistics, Power BI and Tableau through hands-on exercises, real-world datasets and practical projects.

5/5(4,890 Reviews)

Level

Advanced

Duration

8 Weeks

Enquire This Course

About
Training Plan
Course Curriculum
New Batch
Projects
Certificate
Testimonials
FAQ
Interview FAQ

Placement Client

Accenture Logo
AWS Logo
Capgemini Logo
Deloitte Logo
Genpact Logo
HP Logo
Intel Logo
Microsoft Logo
Infosys Logo
Zoho Logo
Zelis Logo
Wipro Logo
Saint Gobain Logo
ONX Logo
Nava Logo
Infosys Logo
HCL Logo
Egon Zehnder Logo
Cognizant Logo
Bosch Logo
Bank of America Logo
Accenture Logo
AWS Logo
Capgemini Logo
Deloitte Logo
Genpact Logo
HP Logo
Intel Logo
Microsoft Logo
Infosys Logo
Zoho Logo
Zelis Logo
Wipro Logo
Saint Gobain Logo
ONX Logo
Nava Logo
Infosys Logo
HCL Logo
Egon Zehnder Logo
Cognizant Logo
Bosch Logo
Bank of America Logo

About Data Analytics Training in Delhi

TechPratham’s Data Analytics Training in Delhi helps students, freshers and working professionals develop practical data analysis skills. Learn Microsoft Excel, SQL, Python, Statistics, Power BI and Tableau through structured lessons and hands-on exercises. Understand data cleaning, data preparation, exploratory data analysis, visualization and dashboard development. Work with business datasets to analyse sales, customer behaviour, financial performance and operational trends. The course also introduces machine learning fundamentals and Generative AI tools for analytics workflows. Build practical knowledge, strengthen analytical thinking and learn to present data-driven insights for business decision-making.

Video Thumbnail

Training Plan

01

About Trainer

Working professional who is carrying more than 10 years of industry experience.

02

Decks & Updated Content

Access to updated presentation decks shared during live training sessions.

03

e-Book

E-book provided by TechPratham. All rights reserved.

04

Assignments & MCQs

Module-wise assignments and MCQs provided for practice.

05

Video Recording

Daily Session would be recorded and shared to the candidate.

06

Projects

Live projects will be provided for hands-on practice.

07

Resume Building

Expert-guided resume building with industry-focused content support.

08

Interview Preparation

Comprehensive interview preparation with real-time scenario practice.

Course Curriculum After This Course

Module 1: Introduction to Data Analytics

Understand data analytics fundamentals, its business applications, different types of analytics and the responsibilities of a data analyst.

Introduction to Data Analytics
Types of Data Analytics
Data Analyst Roles and Responsibilities
Data Analytics Lifecycle
1. Industry Applications of Data Analytics

Module 2: Microsoft Excel for Data Analysis

Learn Excel functions and analytical techniques to organise, clean, calculate and analyse business data.

Excel Interface and Data Formatting
Basic and Advanced Excel Formulas
Lookup Functions
Pivot Tables and Pivot Charts
Data Validation and Conditional Formatting

Module 3: SQL and Database Fundamentals

Learn how to retrieve, filter, combine and analyse structured data using SQL queries and relational databases.

Database Fundamentals
SELECT, WHERE and ORDER BY
GROUP BY and Aggregate Functions
Joins and Subqueries
SQL Functions and Data Filtering

Module 4: Python Programming Fundamentals

Understand Python programming concepts and develop the coding foundation required for data analysis tasks.

Python Installation and Environment
Variables and Data Types
Conditional Statements
Loops and Functions
1. Lists, Tuples, Sets and Dictionaries

Module 5: Python Libraries for Analytics

Work with popular Python libraries to manipulate datasets, perform calculations and prepare data for analysis.

Introduction to NumPy
NumPy Arrays and Operations
Pandas Series and DataFrames
Data Filtering and Aggregation
1. Importing and Exporting Datasets

Module 6: Statistics for Data Analytics

Learn statistical concepts that help interpret datasets, identify patterns and make informed analytical decisions.

Descriptive Statistics
Mean, Median and Mode
Variance and Standard Deviation
Probability Fundamentals
Correlation and Hypothesis Testing

Module 7: Data Cleaning and EDA

Learn to identify data quality issues, handle missing values and perform exploratory analysis to discover useful patterns.

Data Quality and Data Preparation
Handling Missing Values
Removing Duplicate Records
Outlier Detection
Exploratory Data Analysis Techniques

Module 8: Data Visualization with Python

Create meaningful charts and visual representations using Python libraries to communicate analytical findings.

Introduction to Matplotlib
Data Visualization with Seaborn
Bar Charts and Line Charts
Histograms and Scatter Plots
Chart Interpretation and Storytelling

Module 9: Power BI for Business Intelligence

Learn to transform business datasets into interactive reports and dashboards using Power BI and DAX.

Power BI Desktop Introduction
Data Import and Power Query
Data Modelling and Relationships
DAX Measures and Calculations
Interactive Reports and Dashboards

Module 10: Tableau for Data Visualization

Understand Tableau fundamentals and build interactive visualizations and dashboards for business reporting.

Tableau Interface and Data Connection
Dimensions and Measures
Charts and Visualizations
Calculated Fields and Filters
Interactive Dashboard Creation

Module 11: Machine Learning and Generative AI

Explore introductory machine learning concepts and understand how Generative AI tools can support analytics workflows.

Introduction to Machine Learning
Supervised and Unsupervised Learning
Regression and Classification Basics
Generative AI for Data Analytics
AI-Assisted Data Analysis

Module 12: Capstone Project and Career Preparation

Apply your learning to practical analytics projects and prepare for entry-level data analytics roles through portfolio and interview practice.

Capstone Project Planning
Dataset Analysis and Preparation
Dashboard and Report Development
Portfolio Preparation
Resume and Interview Preparation

High Demanding Courses

No related courses found

Additional Program Highlights

Learning Materials

Comprehensive study materials and resources

Resume Writing

Professional resume building session

Interview Preparation

Master your interview skills

Live Project Demo

Real-world project demonstrations

Upcoming Batches

Can't find a batch you were looking for?

Who Should Take This Course? -

IT Professionals

Non-IT Career Switchers

Fresh Graduates

Job Roles After This Course

Data Analyst

Junior Data Analyst

Business Analyst

Key Projects

Practical Projects of Data Analytics Training in Delhi

Accenture

Accenture – Retail Sales Dashboard


Scenario: A retail business wants to analyse store sales, product performance and monthly revenue using business data.

Live Work:

  • Clean sales data using Excel
  • Analyse transactions using SQL
  • Build interactive Power BI dashboards
Outcome: Clear sales and product insights
Deloitte

Deloitte – Customer Insights Analysis


Scenario: An e-commerce business wants to understand customer behaviour, purchase trends and repeat orders through data analysis.

Live Work:

  • Prepare customer data using Python
  • Analyse purchase trends with Pandas
  • Visualize customer segments
Outcome: Better customer behaviour insights
WNS

WNS – Financial Performance Report


Scenario: A finance team needs to analyse revenue, expenses and budget performance across business departments.

Live Work:

  • Clean financial records in Excel
  • Analyse transactions using SQL
  • Create Tableau financial reports
Outcome: Improved financial reporting clarity
Saint Gobain

Saint Gobain – HR Analytics Dashboard


Scenario: An organisation wants to analyse employee headcount, attendance, attrition and department-level workforce trends.

Live Work:

  • Prepare employee data using Python
  • Analyse workforce trends with SQL
  • Build HR dashboards in Power BI
Outcome: Better workforce visibility

Placement Process

2Assignments
Step 2

Daily Assignment & Weekly Assessments

  • Hands-on practice
  • Concept reinforcement
  • Weekly evaluation
  • Timely feedback

Latest HiringNEW

No hiring posts

Recently Placed Candidates

No placements available

Latest HiringNEW

No hiring posts

Our Success Mantra

Commitment Icon
Commitment

  • Ensuring quality training every day

Commitment Icon
Fulfillment

  • Meeting learning goals with confidence

Commitment Icon
Accomplishment

  • Students achieving industry-ready expertise

Our Learner Voice

Loading reviews...

Beyond Courses:

Additional Support We Provide

24/7 Support

LinkedIn Profile

Resume Writing

Alumni Sessions

Interview Preparation

Live Projects

Where We've Delivered

Corporate training we've delivered for leading companies

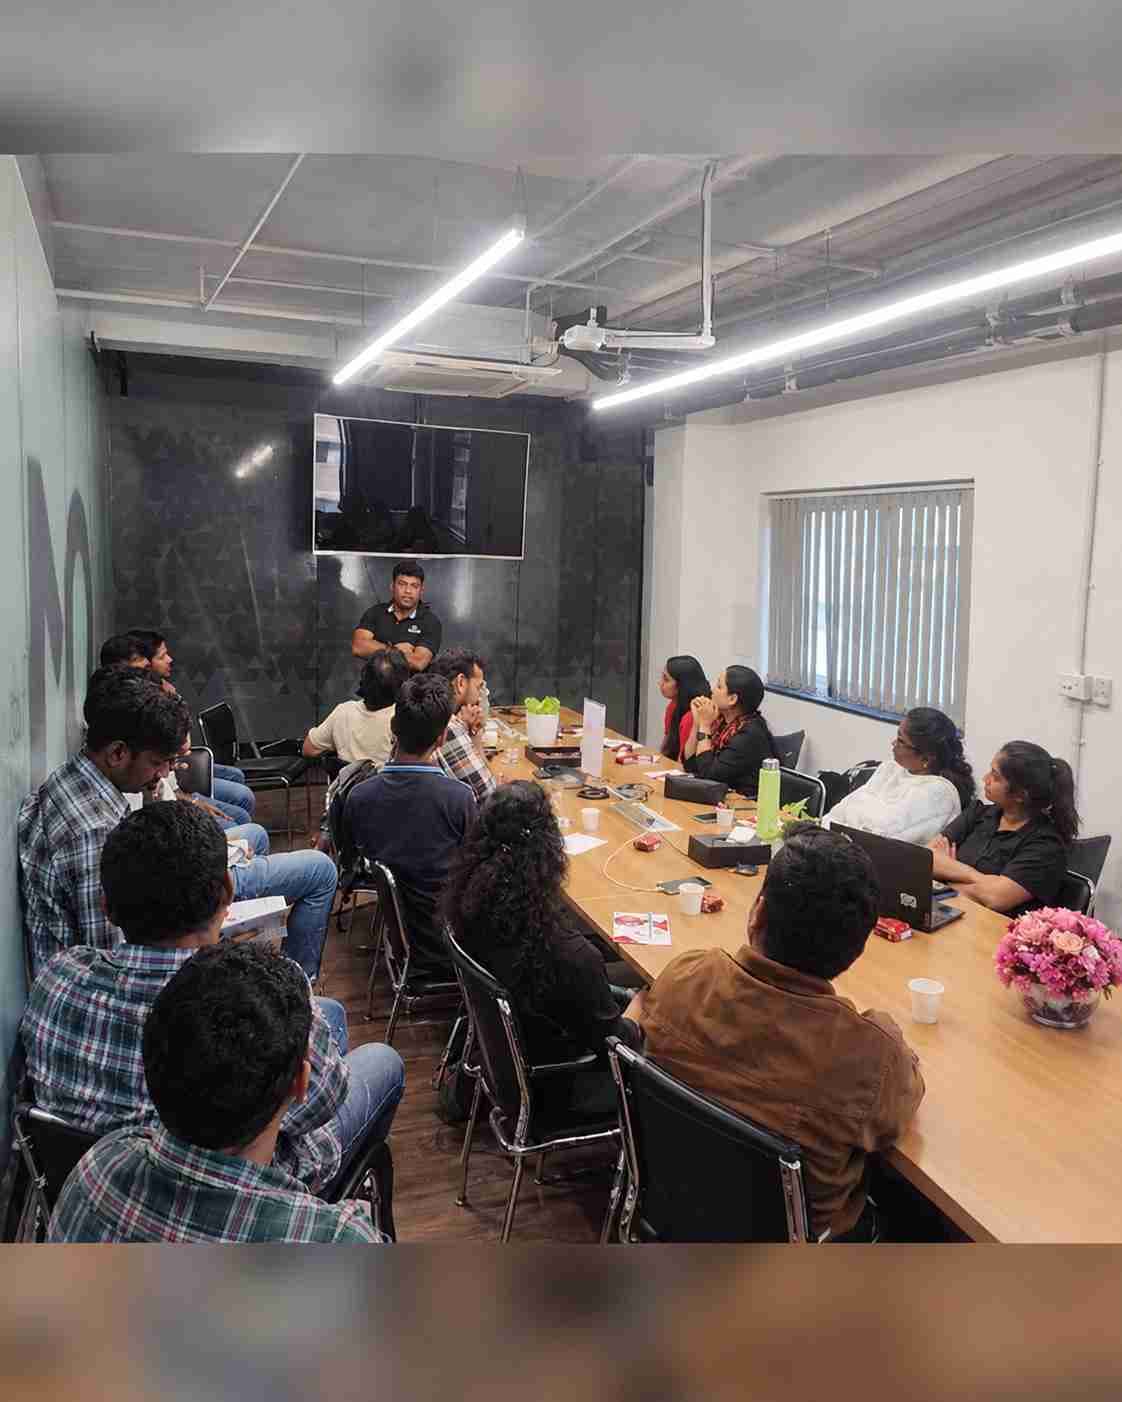
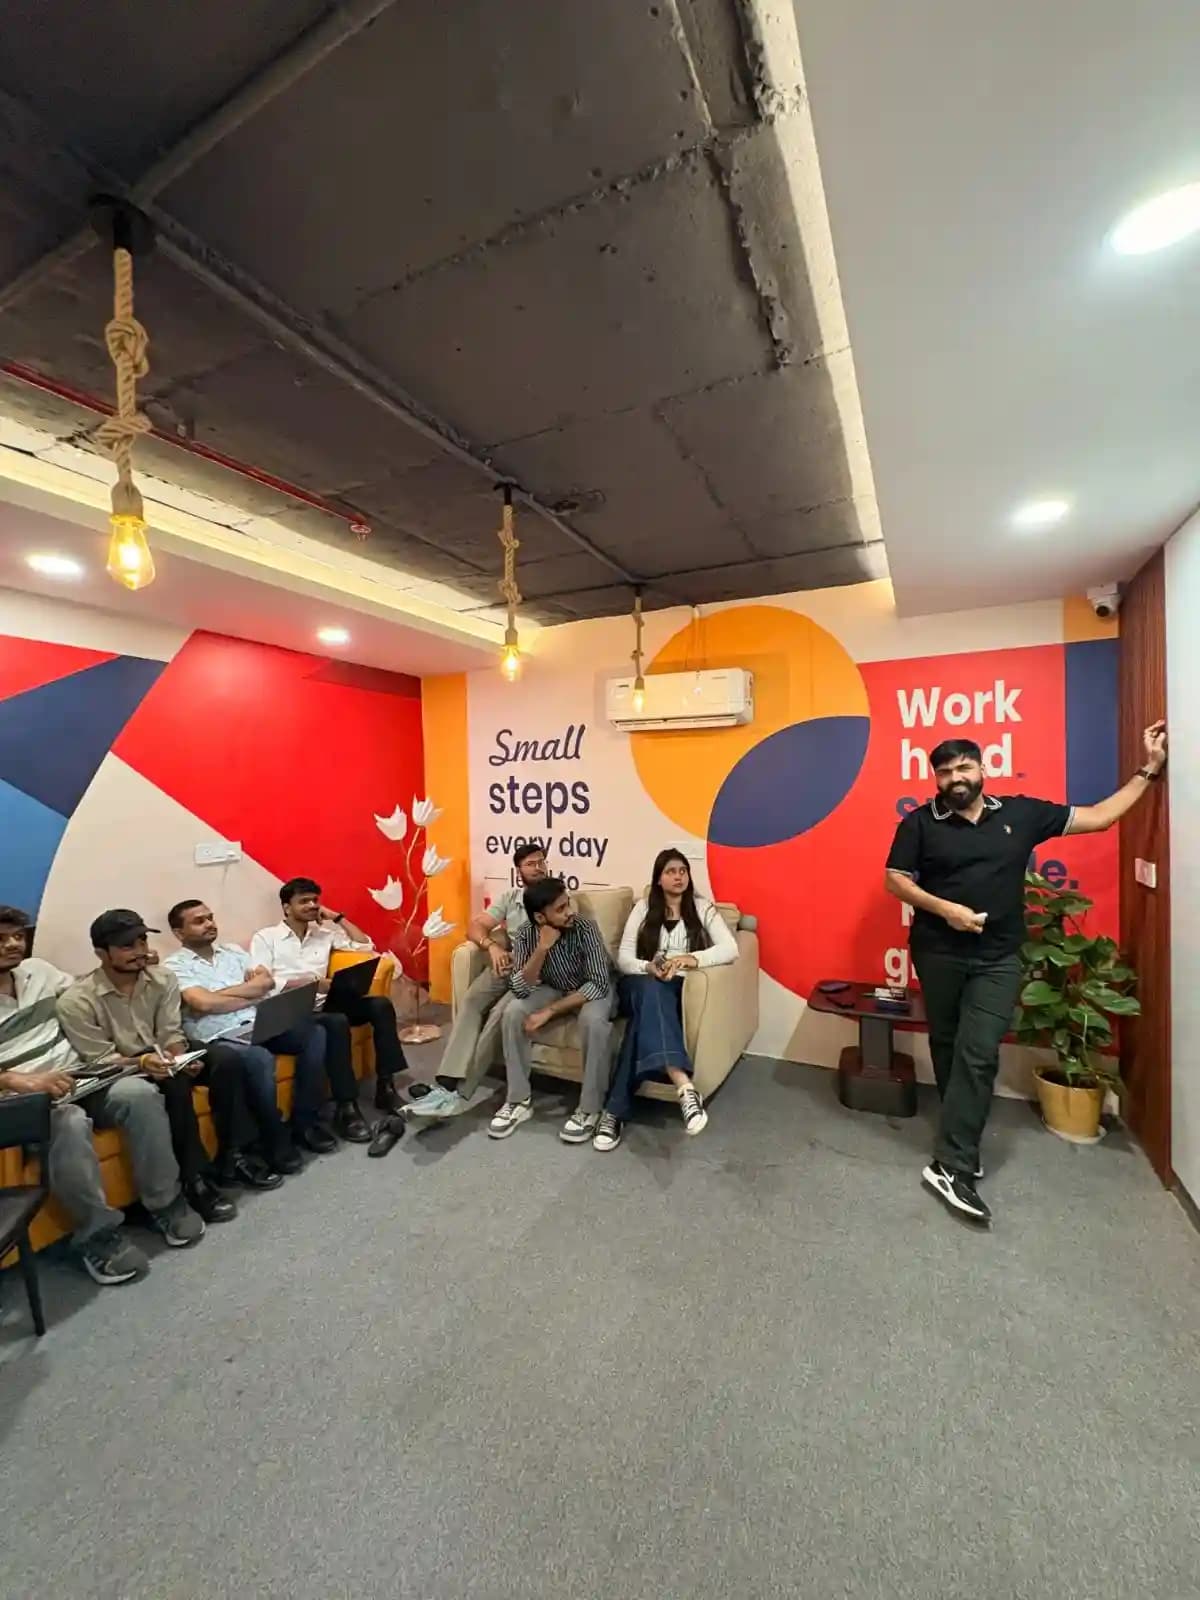
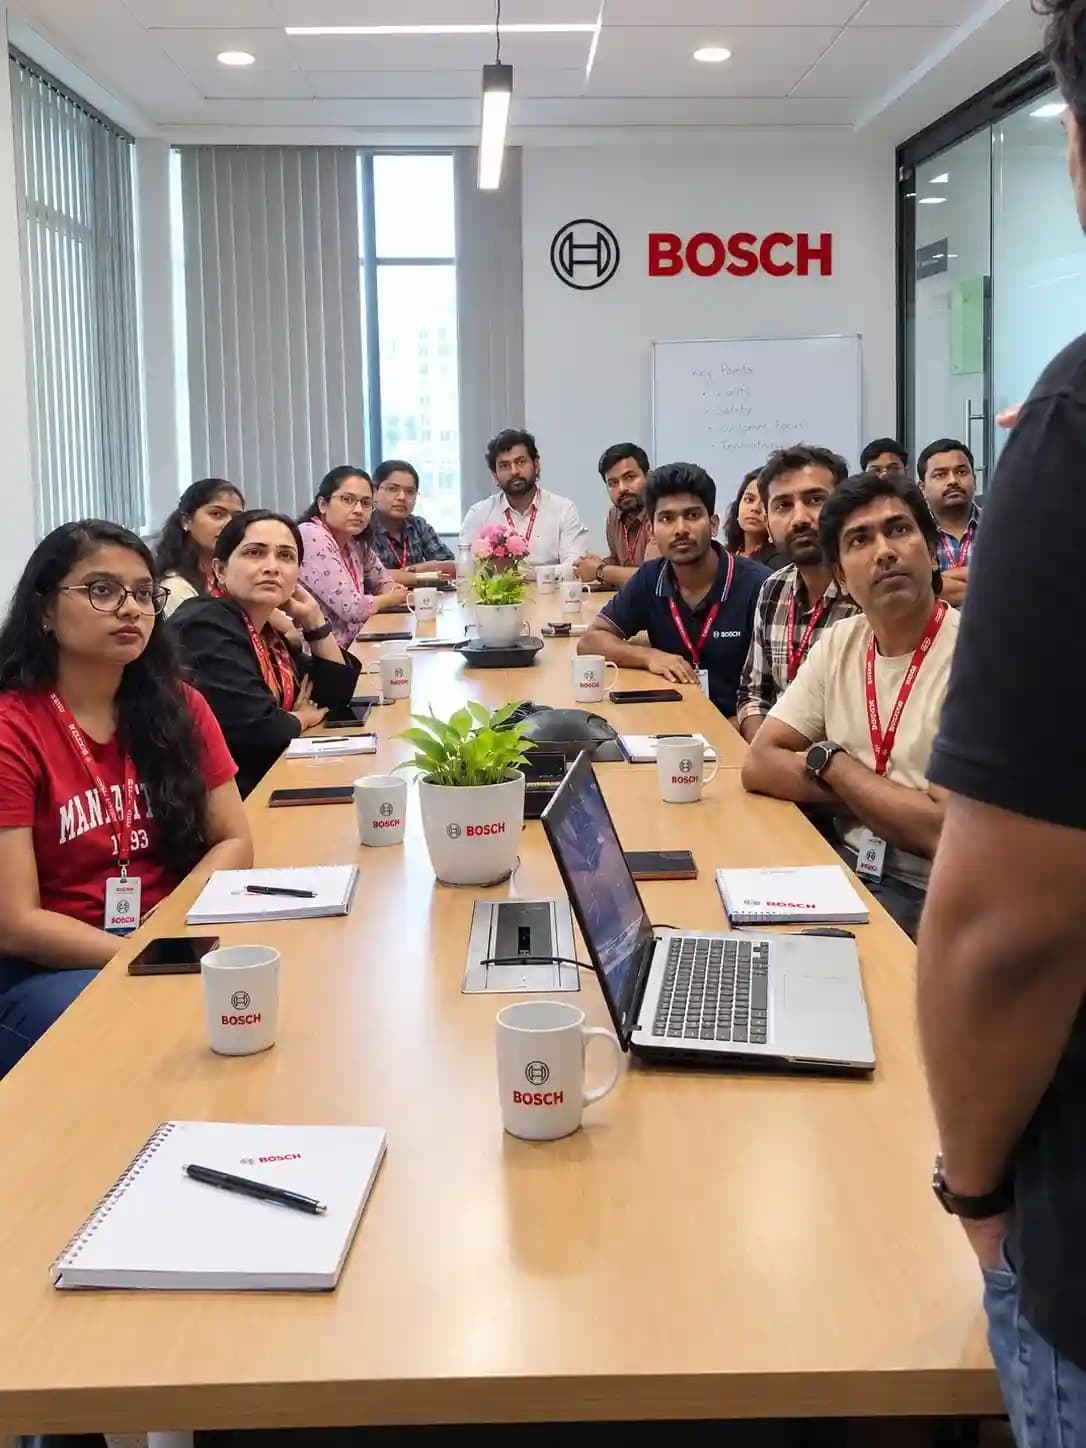
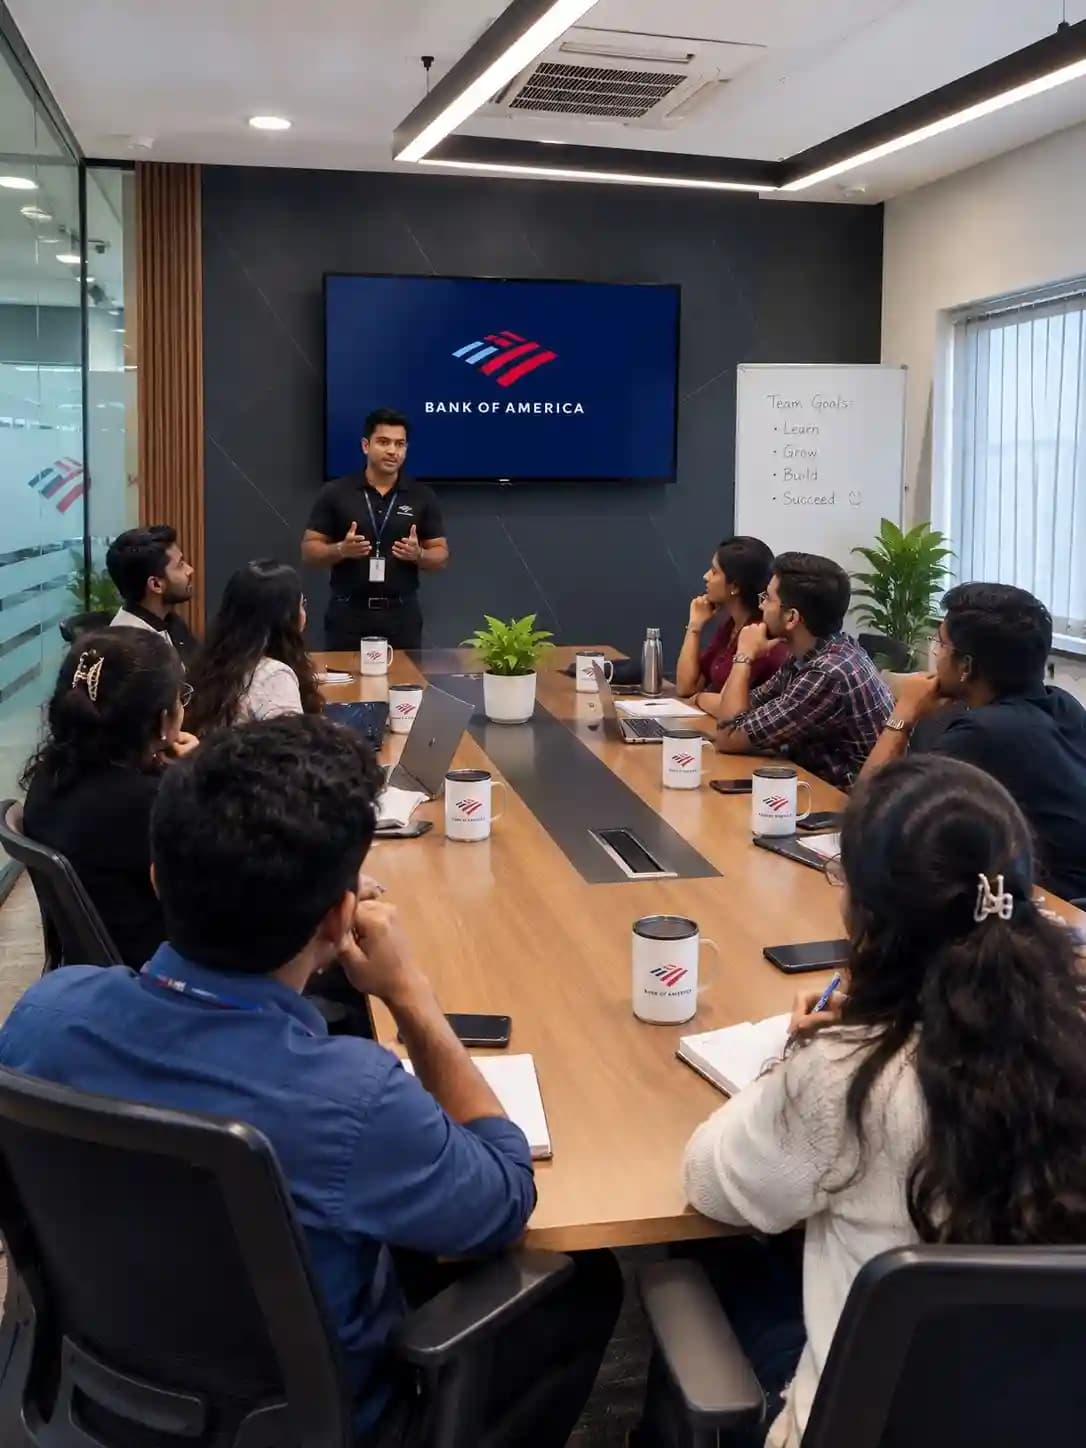
TechPratham has partnered with enterprises and government organizations to upskill their teams. From Balmer Lawrie & Co. Ltd. to other industry leaders, here's a glimpse of the corporate training programs we have successfully delivered.

  • Trusted by enterprises and government organizations
  • Customized to each company’s teams and workflows
  • On-site and online delivery for teams of any size
Saint-Gobain Corporate Training
QualiZeal Corporate Training
College Freshers Training
BOSCH Corporate Training
WNS Corporate Training
Central Bank Training
Bank of America Training
Balmer Lawrie Training
Delivery Hero Corporate Training
TechPratham Offline Training
Gravity Corporate Training
On-Site Corporate Training
HARMAN Corporate Training

Saint-Gobain Corporate Training

What is Data Analytics Training in Delhi?

How long does the Data Analytics course take?

Can beginners learn data analytics?

Does the course include practical projects?

Can non-technical students join this course?

What Is Data Analytics?

What Is the Difference Between Data Analysis and Data Analytics?

What Is SQL Used for in Data Analytics?

What Is the Difference Between Power BI and Tableau?

What Is Exploratory Data Analysis?

What Is the Role of Python in Data Analytics?

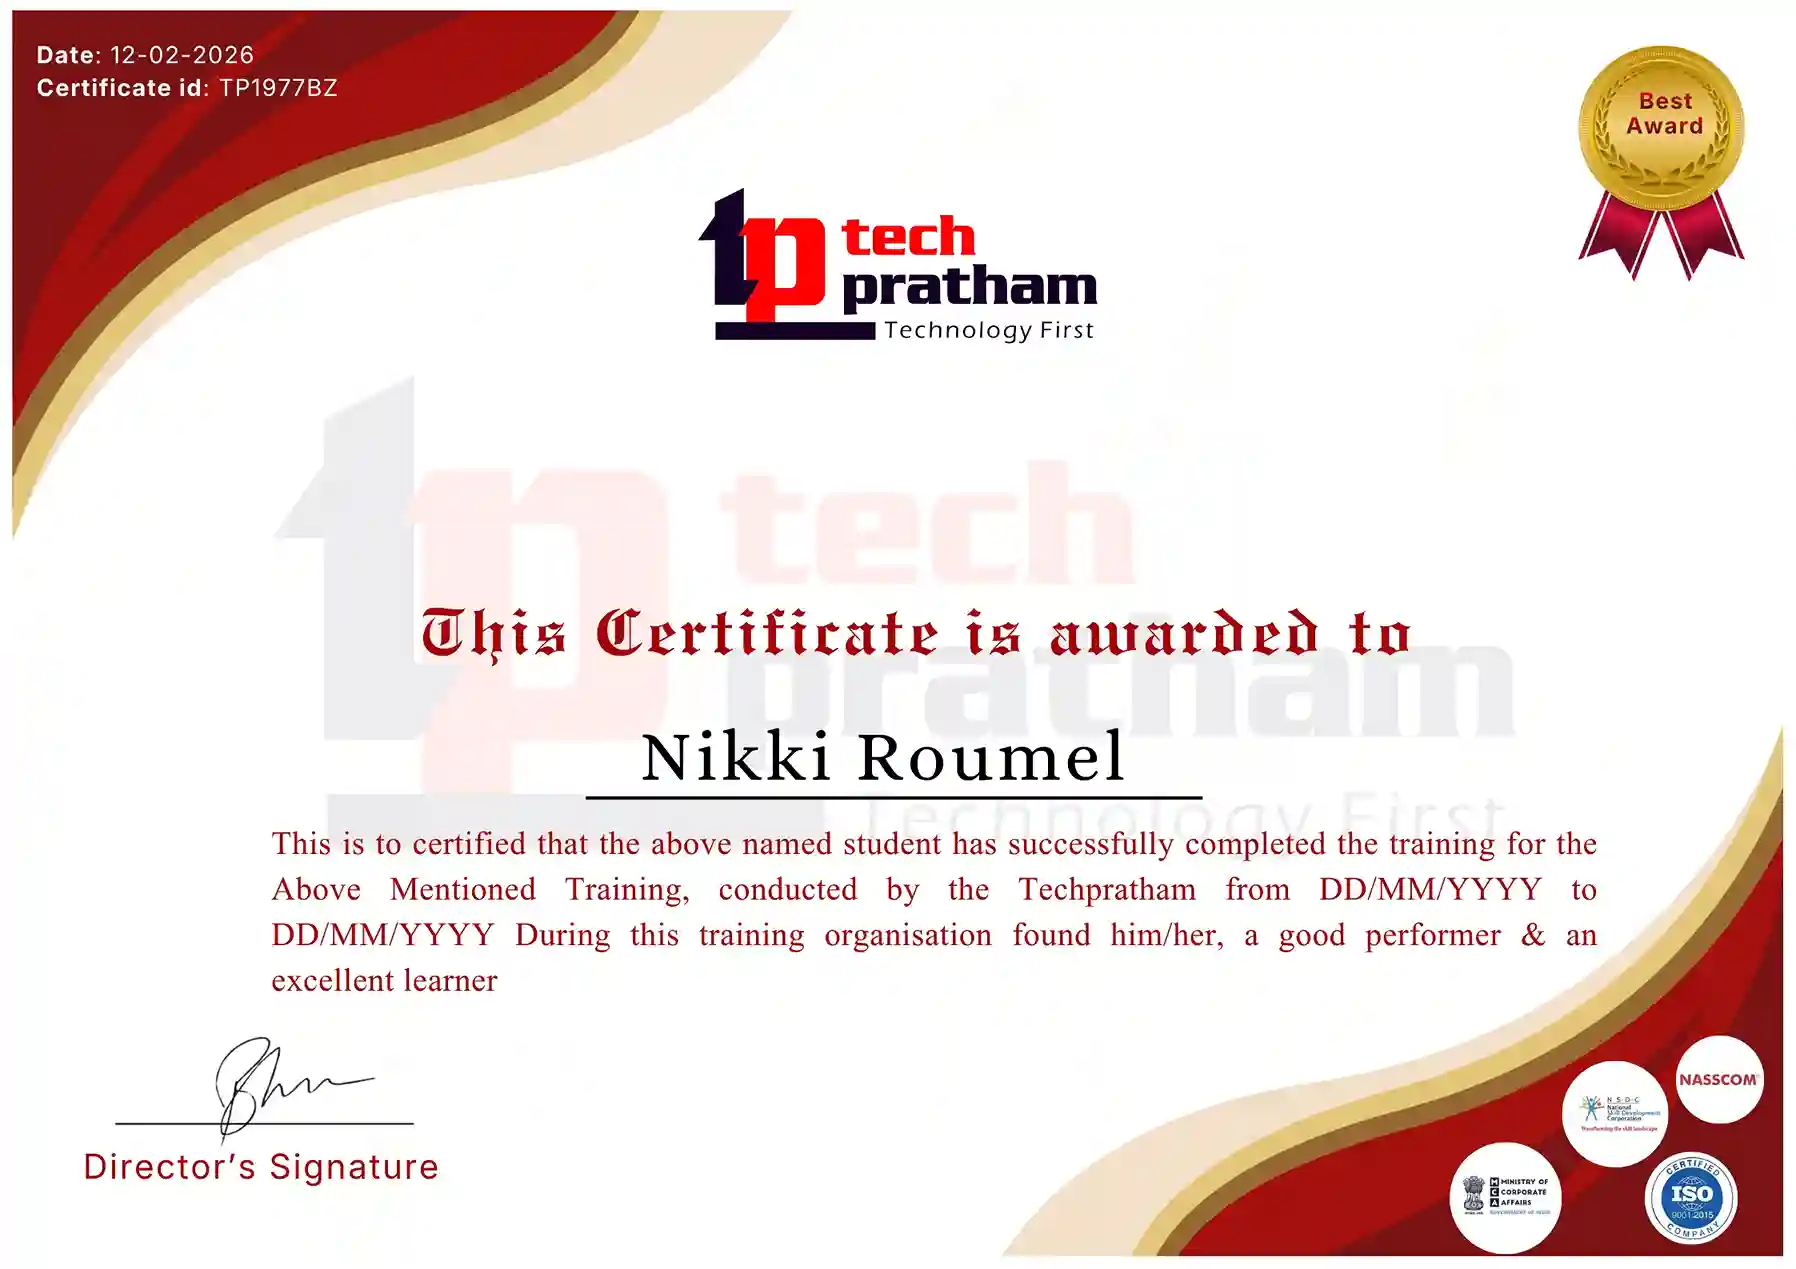
About Certification Course Data Analytics Training in Delhi

After successfully completing the course requirements, learners can receive a TechPratham course completion certificate. This certificate recognises course participation and completion. External vendor certifications, such as Microsoft or Tableau certifications, are separate and may require their own examinations.

Industry-Recognized Certification

Certificate
Data Analytics Training

Our LinkedIn learning hub

Explore our professional communities — tap any card to join and connect with us on LinkedIn.

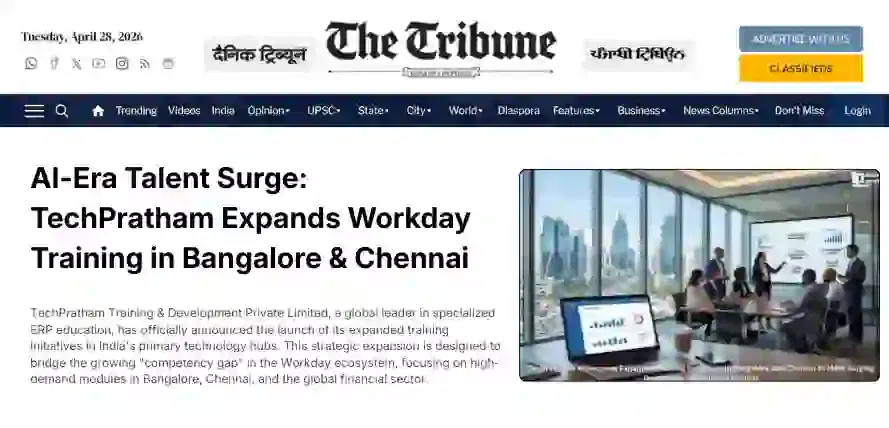
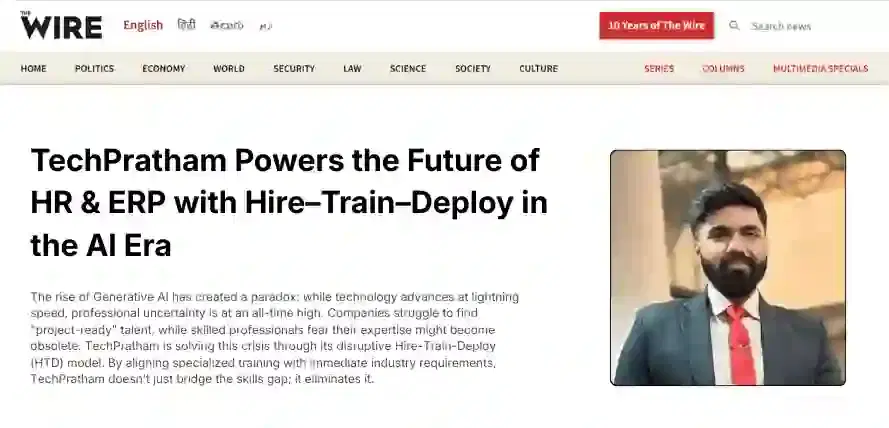
News Highlights

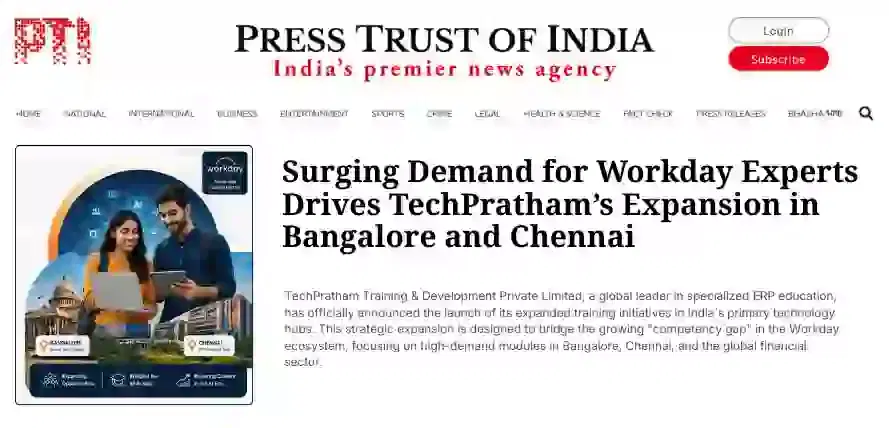
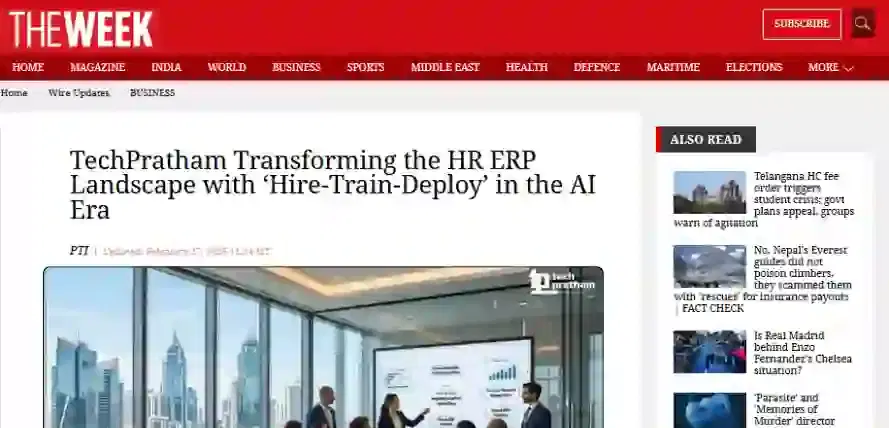
TechPratham Introduces Hire-Train-Deploy Model to Transform HR & ERP Talent in the AI Era
TechPratham Empowering Future Professionals Through AI-Focused HR & ERP Training

Featured In

Featured Logo 1Featured Logo 2Featured Logo 3Featured Logo 4Featured Logo 5Featured Logo 6Featured Logo 7Featured Logo 8Featured Logo 9Featured Logo 10Featured Logo 11Featured Logo 12
TechPratham Gains Recognition for Bridging the HR & ERP Skills Gap with Hire-Train-Deploy
TechPratham's Hire-Train-Deploy Approach Reshaping HR & ERP Careers in the AI-Driven Industry